Total Variation Minimization Photometry
Benjamin Pope, NYU
CCA Stars Meeting
Feb 7 2018
benjaminpope.github.io/talks/ccafeb7/ccafeb7
Kepler Photometry
but the pixels have different gains ("inter- and intra-pixel sensitivity variation")...
and the pixel window doesn't necessarily track the whole PSF perfectly ("aperture losses").
We will be motivated by this here.
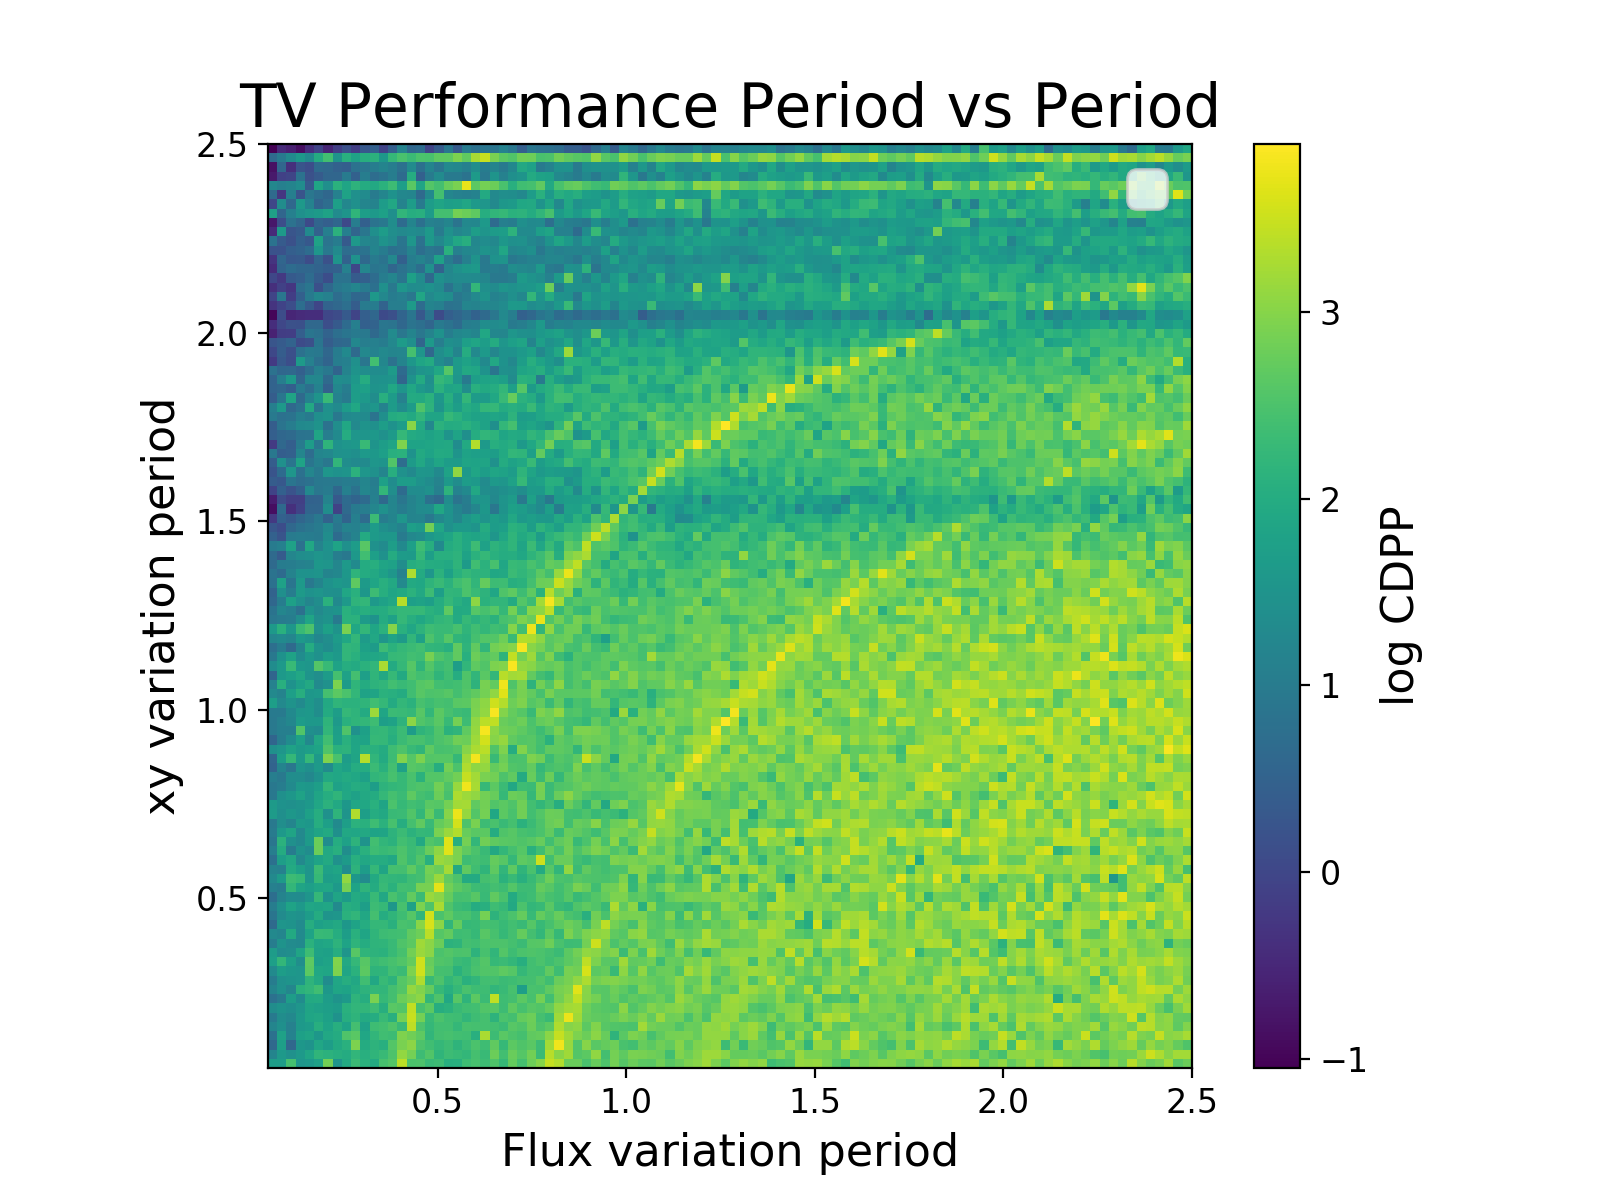
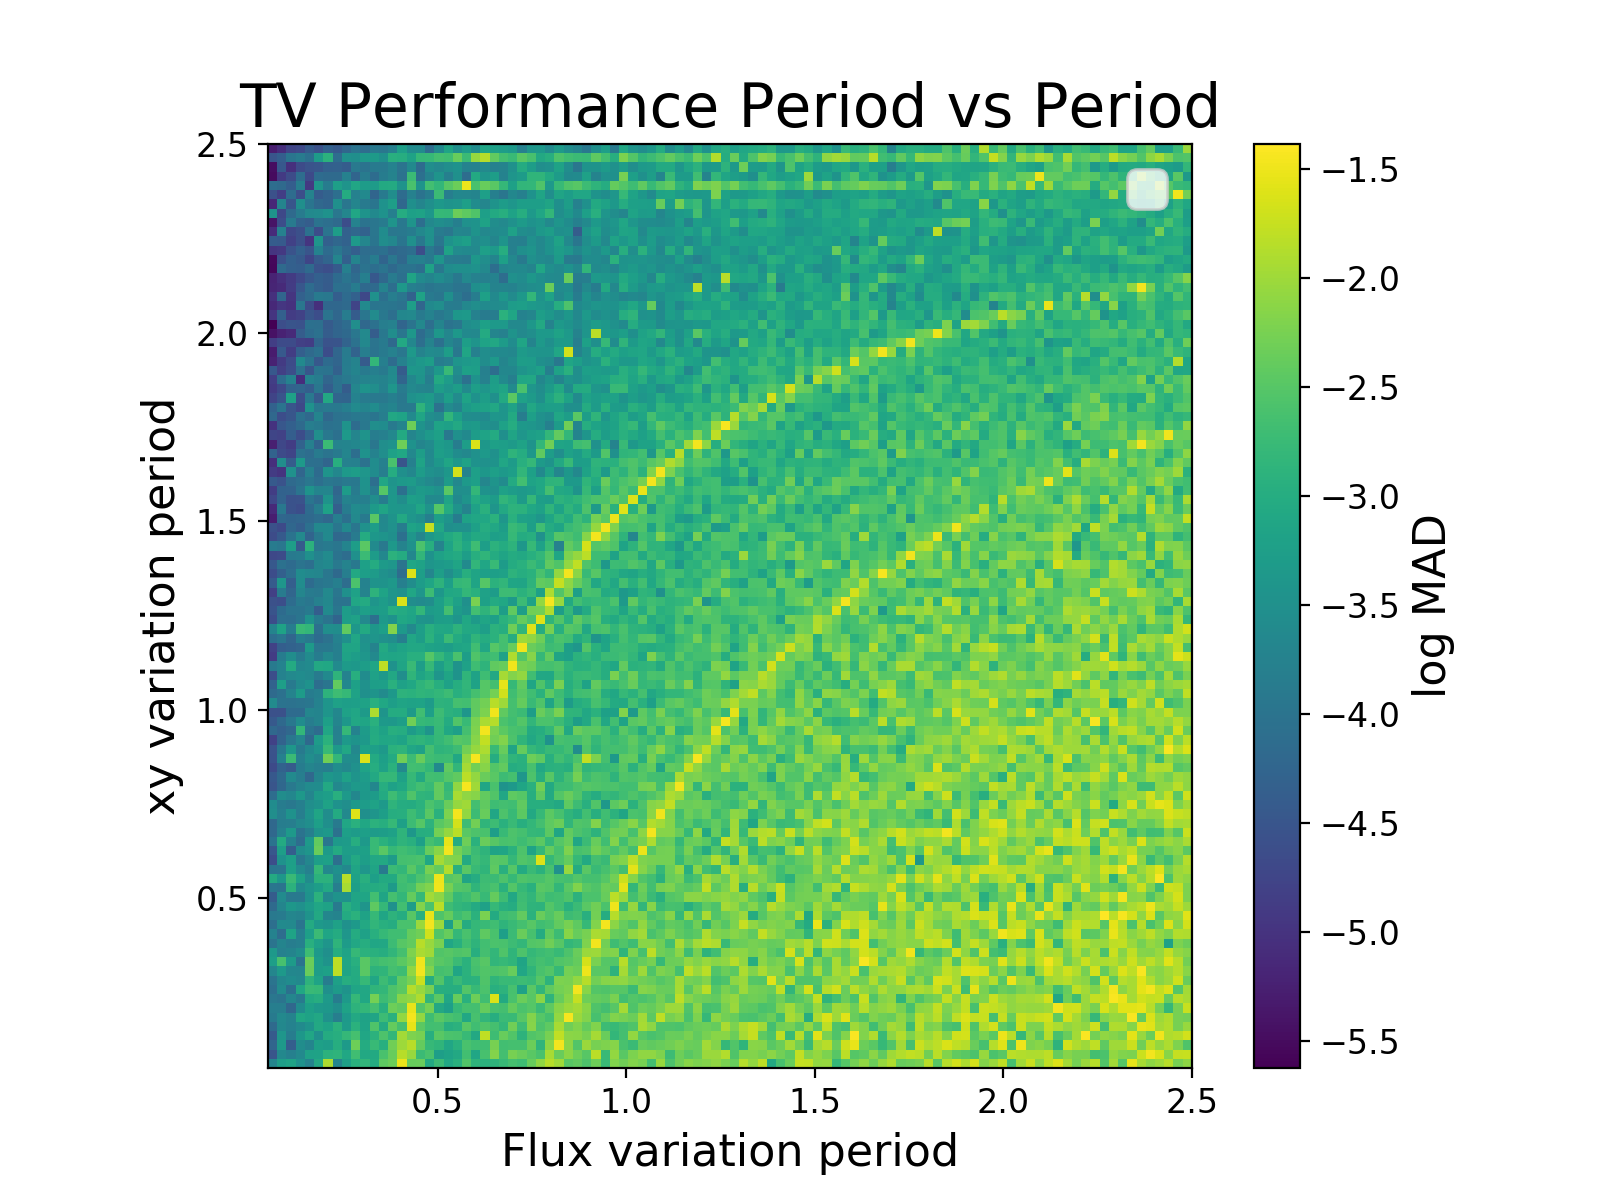
Halo Photometry
\[ f_i \equiv \sum\limits_i w_j p_{ij} \]
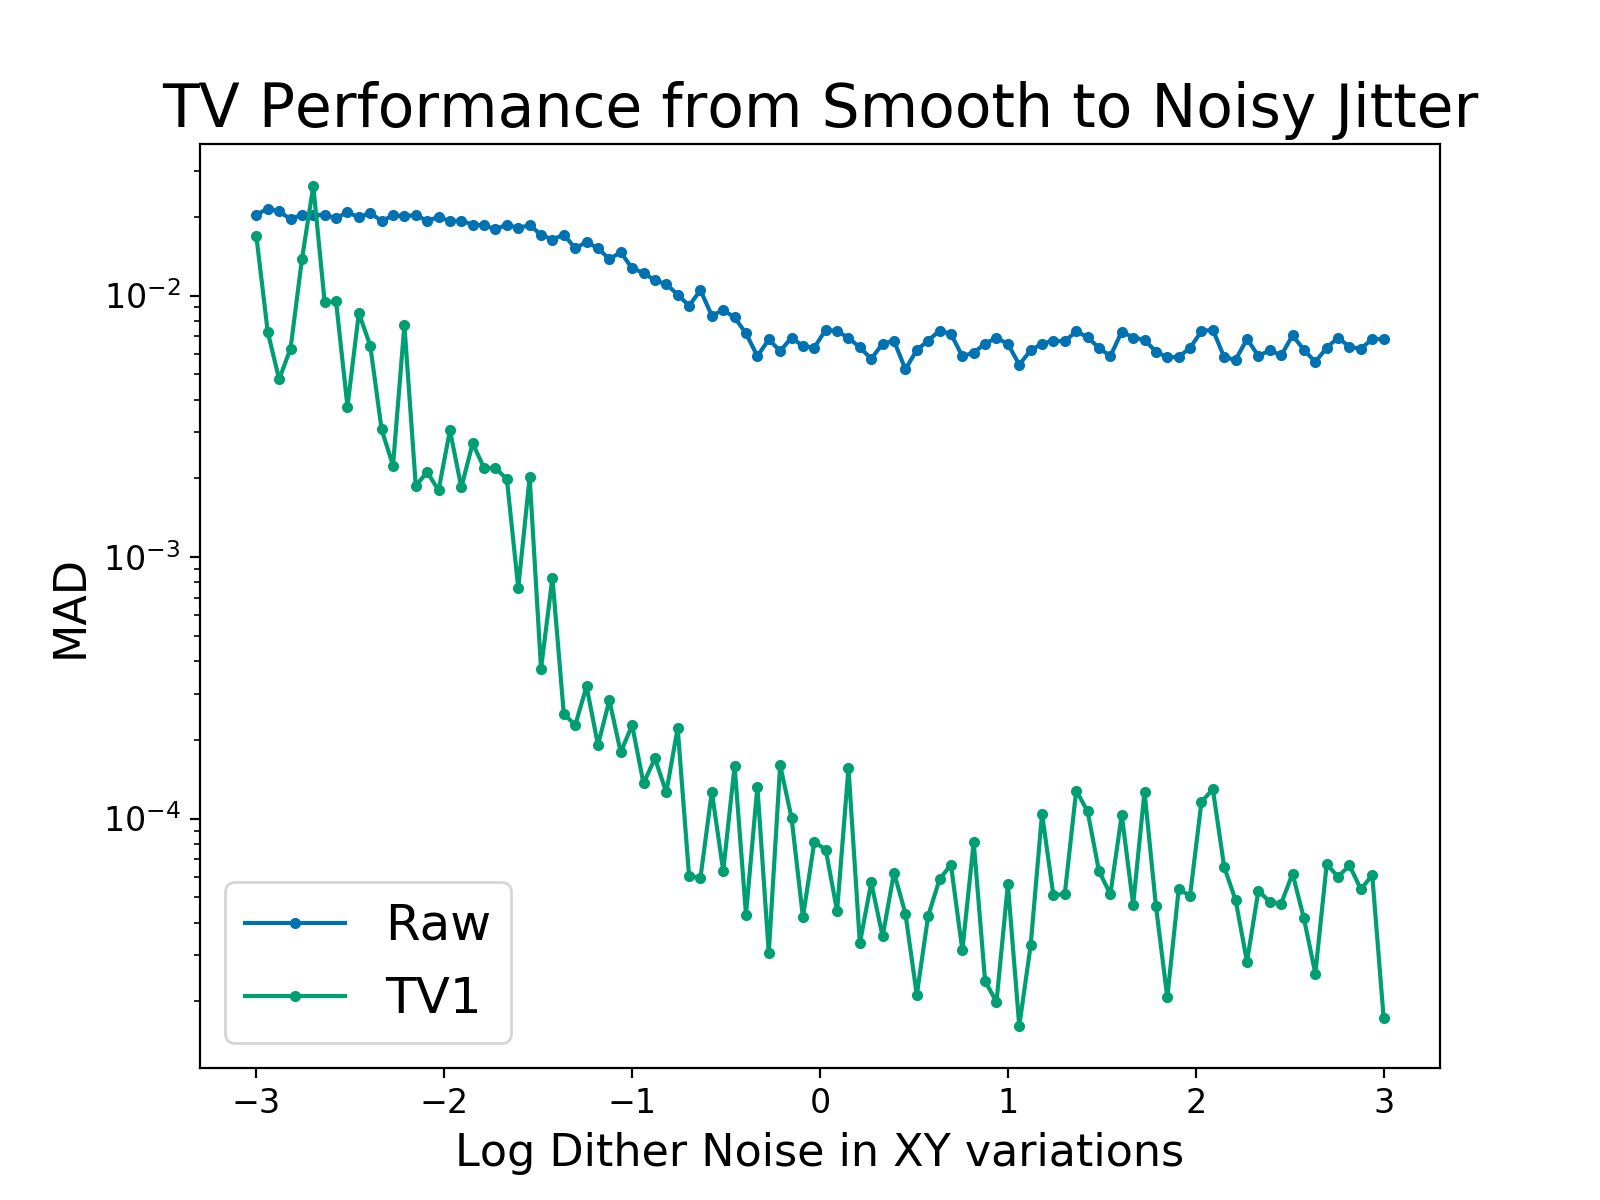
\[\begin{align} TV \equiv \dfrac{\sum_i |f_i - f_{i-1}|} {\sum_i f_i } \end{align} \]
This is the L1 norm on the derivative of the time series.
This has analytic derivatives in Theano - easy to optimize.
Kepler light curves are not sparse in the derivative.
But they're sparse in the Fourier domain... perhaps this is relevant?
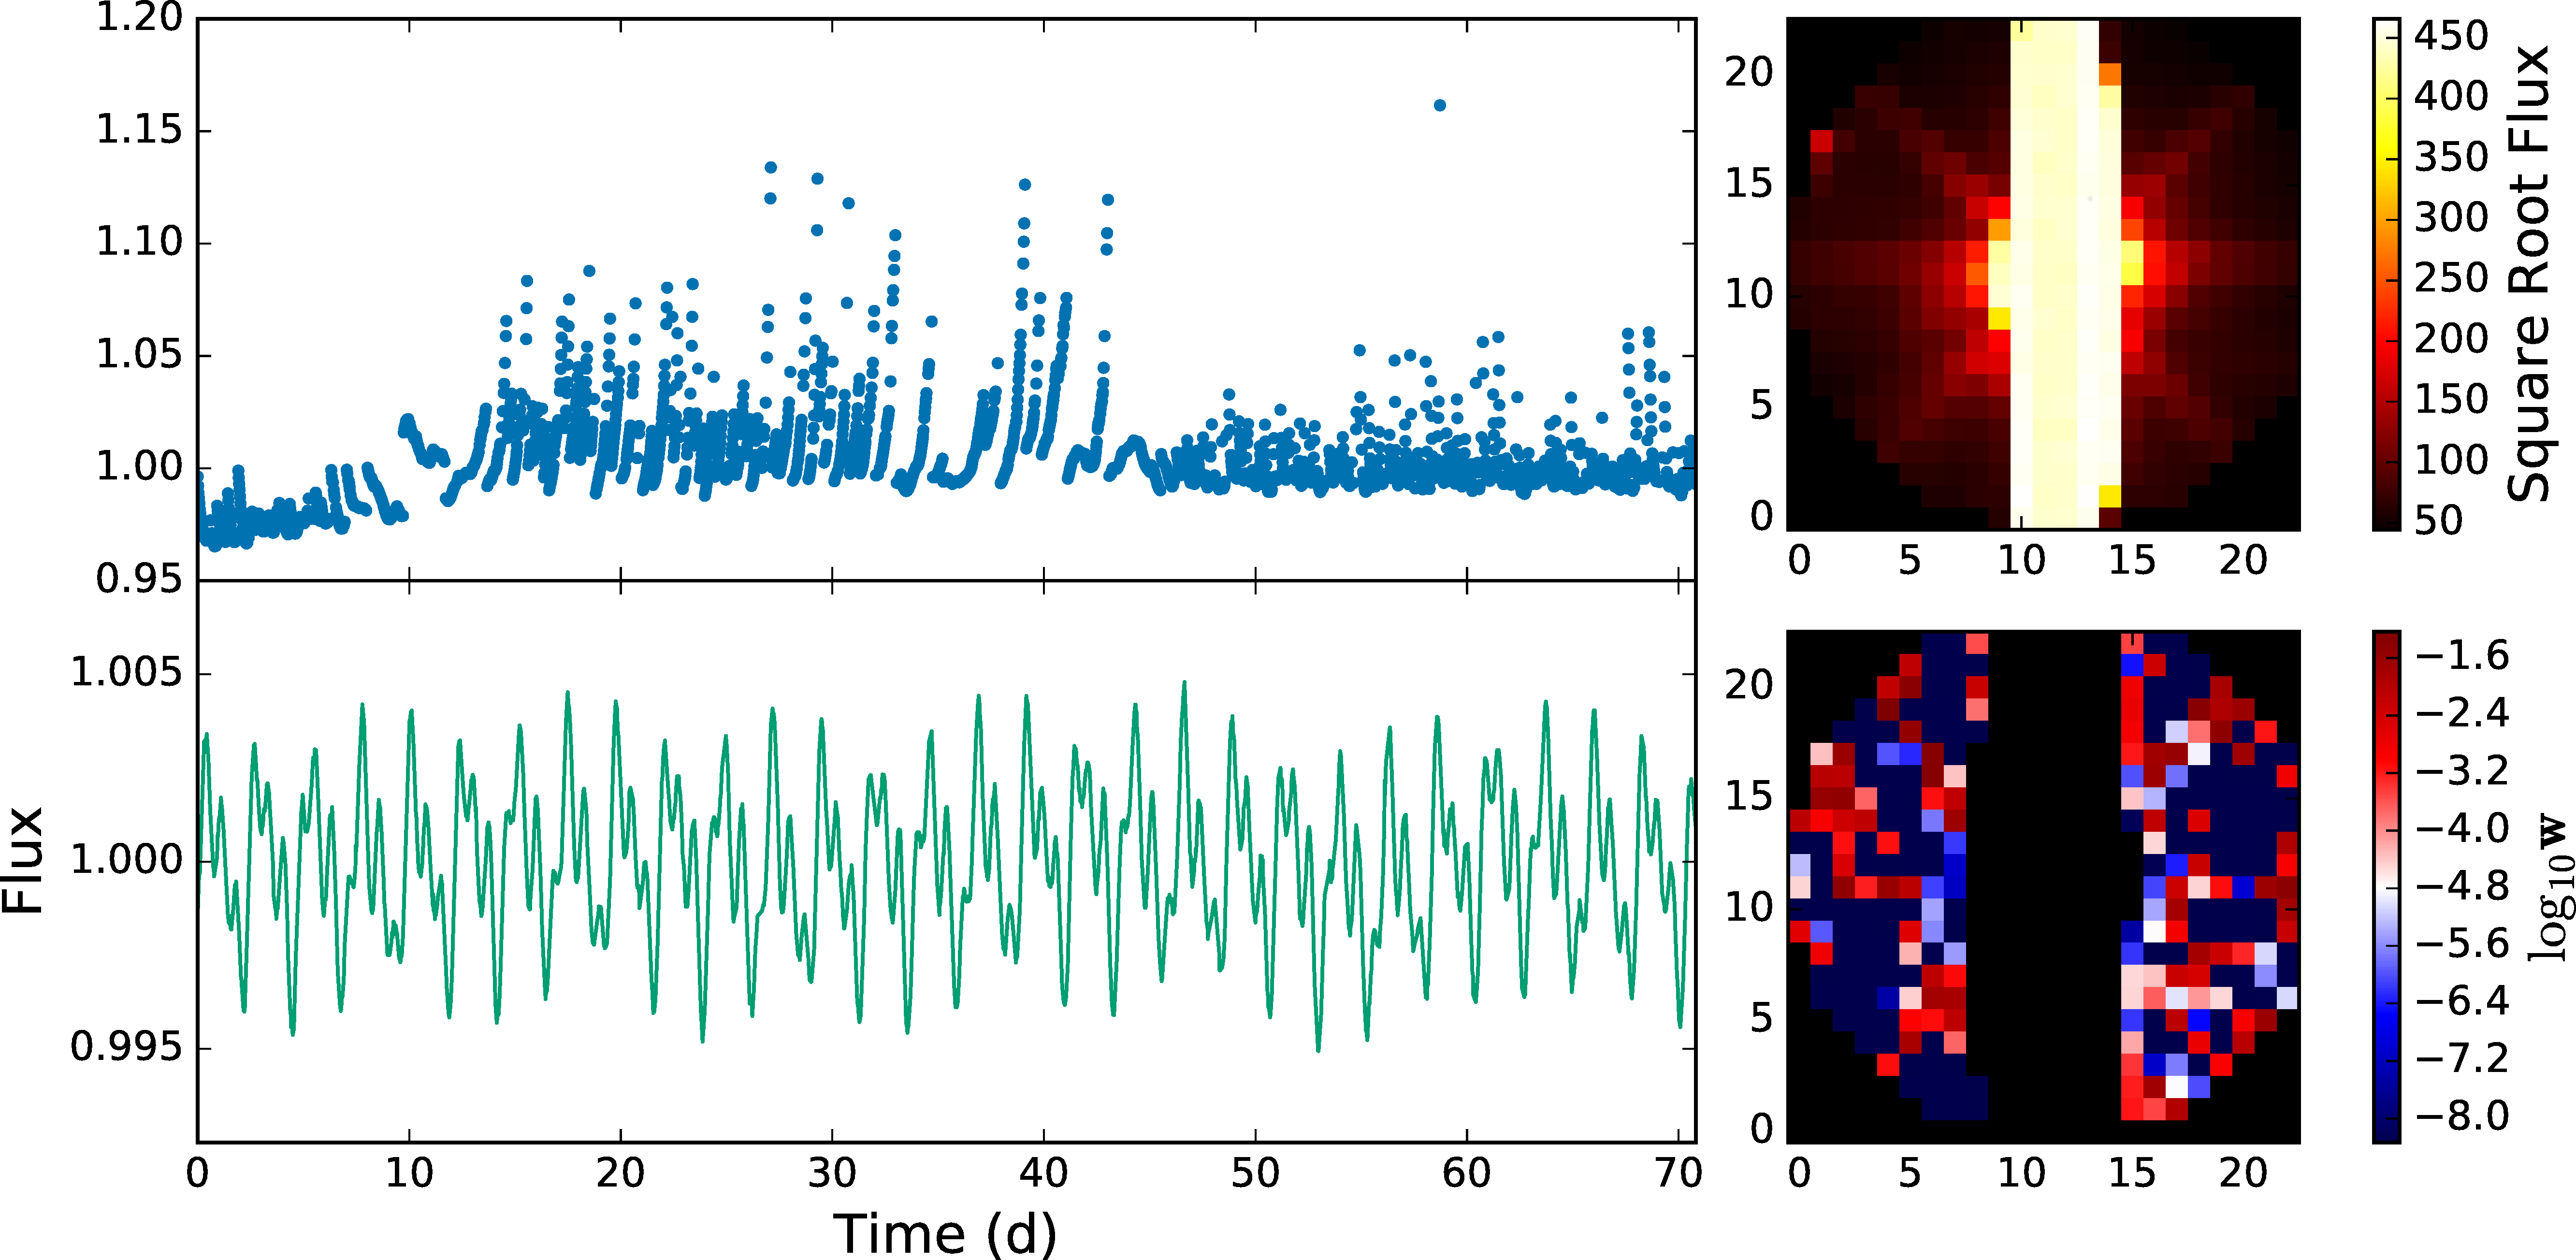
Atlas lightcurve: raw (top) and halo (bottom)
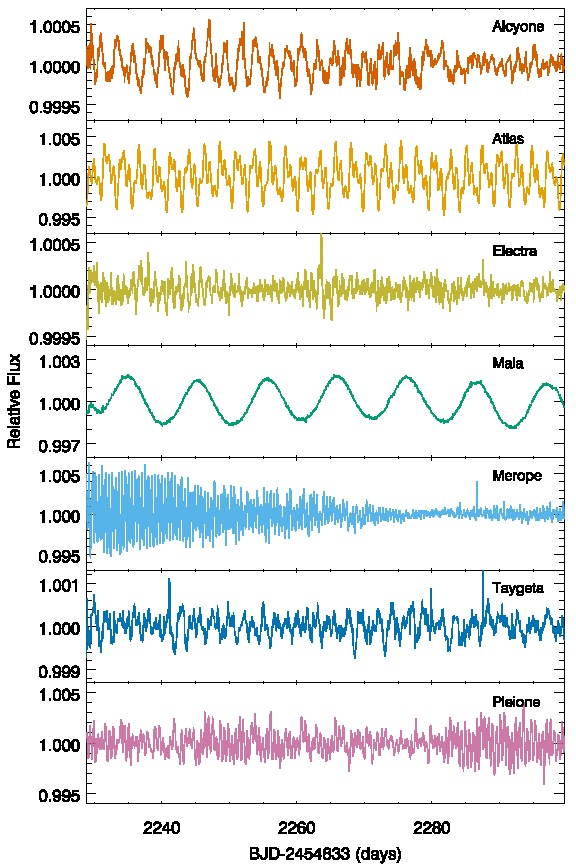
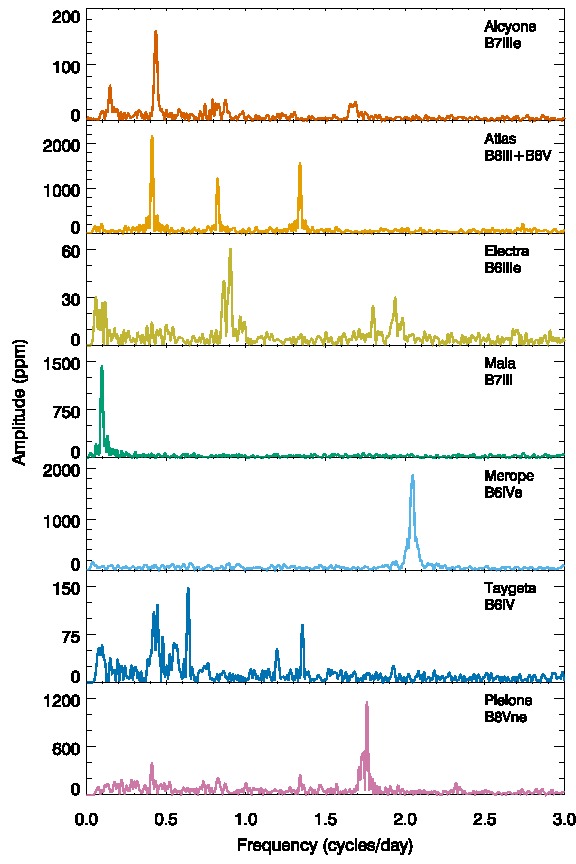
Lightcurves of All Seven Bright Pleiades
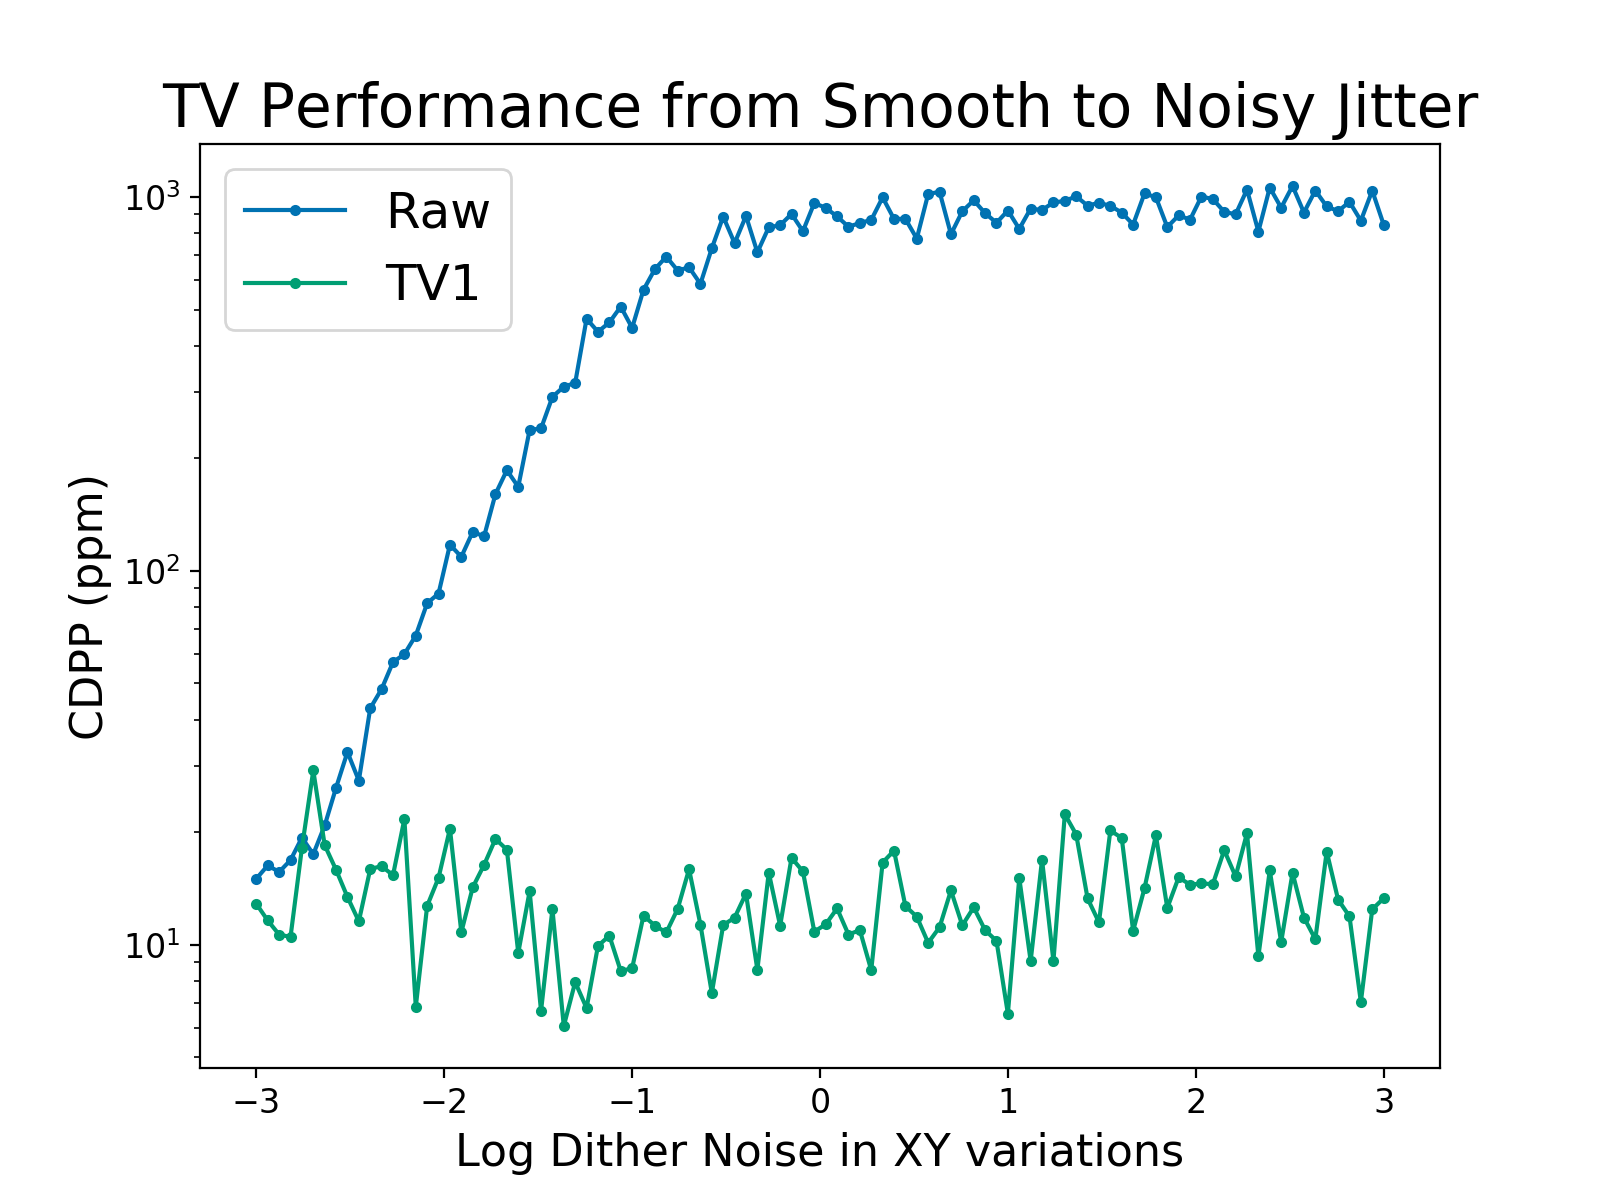
						x, y = np.sin(2*np.pi*t/20.), np.cos(2*np.pi*t/20.) # smooth
						f = 20*np.ones(ncad) + np.sin(t)
						f[400:500] *= 0.9 # toy transit

						log_snrs = np.linspace(-3, 3,100)

						for jj, snr in enumerate(log_snrs):

							xx, yy = x + xamp*(10**snr)*np.random.randn(len(x)), y + yamp*(10**snr)*np.random.randn(len(y))

						### ... [guts of loop etc]
Pleiades
Πλειάδες, the Seven Sisters
Alcyone, Atlas (dad), Electra, Maia, Merope, Taygeta, Pleione (mum)
Atlas lightcurve: raw (top) and halo (bottom)
Lightcurves of All Seven Bright Pleiades
I am currently searching all bright stars in K2 for transiting planets - none so far, but plenty of asteroseismology!
The Future
We need your help to be able to understand and improve photometry tools.